


Data Governance starter kit
#12 How to bring value with no resource

Hello 😀
I know a lot of you have budget constraints, especially when it’s hard to show data governance value. I want to show you how you can do great things with little resources.

My online course “Define your Data Governance strategy” has been updated and is available in a Notion space with all lectures, videos and templates that I will update regularly, you can join it here :
If you haven't already, you can also :
Discover my coaching services
Join +170 readers of “Data Governance : where to start?”
Follow me on Linkedin and Twitter
Let’s see how to build something 👇
Agenda
Clarify the needs
Setup & share central knowledge
Re-Focus on critical issues
Clarify
You know the pains :
🤯 people are asking 10 times a day if this data exist or not,
🤯 why isn't the KPI in tool A the same as in tool B,
🤯 why do the figures differ between production and BI.
It wastes a lot of your time. This is annoying, because you already have the answers to these questions, but you lack the documentation to make the information available to everyone.
What happens at this moment usually is that someone from Data or Tech team will propose to integrate a data catalog to solve all these issues.
❌ I think it’s a mistake, at least when you still don’t know what people really want.
To know this, you need to go deeper and ask specific questions :
Do people need the answer just one time and that’s it? Or will they have several requests per day?
Which data are they looking for : granularity, temporality, source type - they need to be precise !
Which information do they need on this data : business definition, the calculation method, dates it was captured, the lineage, etc…
Do they need to do stuff with the data : download it? play with it in a dashboard?
What are the top 3 indicators they need to look at to do their job efficiently?
How are these indicators calculated according to them? How do they know?
Which reports are they using for these indicators?
Either you take 3-5 people who will be representative of business pains and you do short interviews with them.
👉 Or if you’re really busy, you can setup a survey and have people answer when they have time. Make sure you have open questions with text answers as well.
Setup & share
Now you know more precisely what people want, great !
Overall all these pains are related to document and make information easily available to decrease time spent on sharing it during meetings.
🔍 Let’s say they wanted to understand how metrics are calculated and in which report they are used.
👉 Well, open Notion, use the following Metrics Database template :
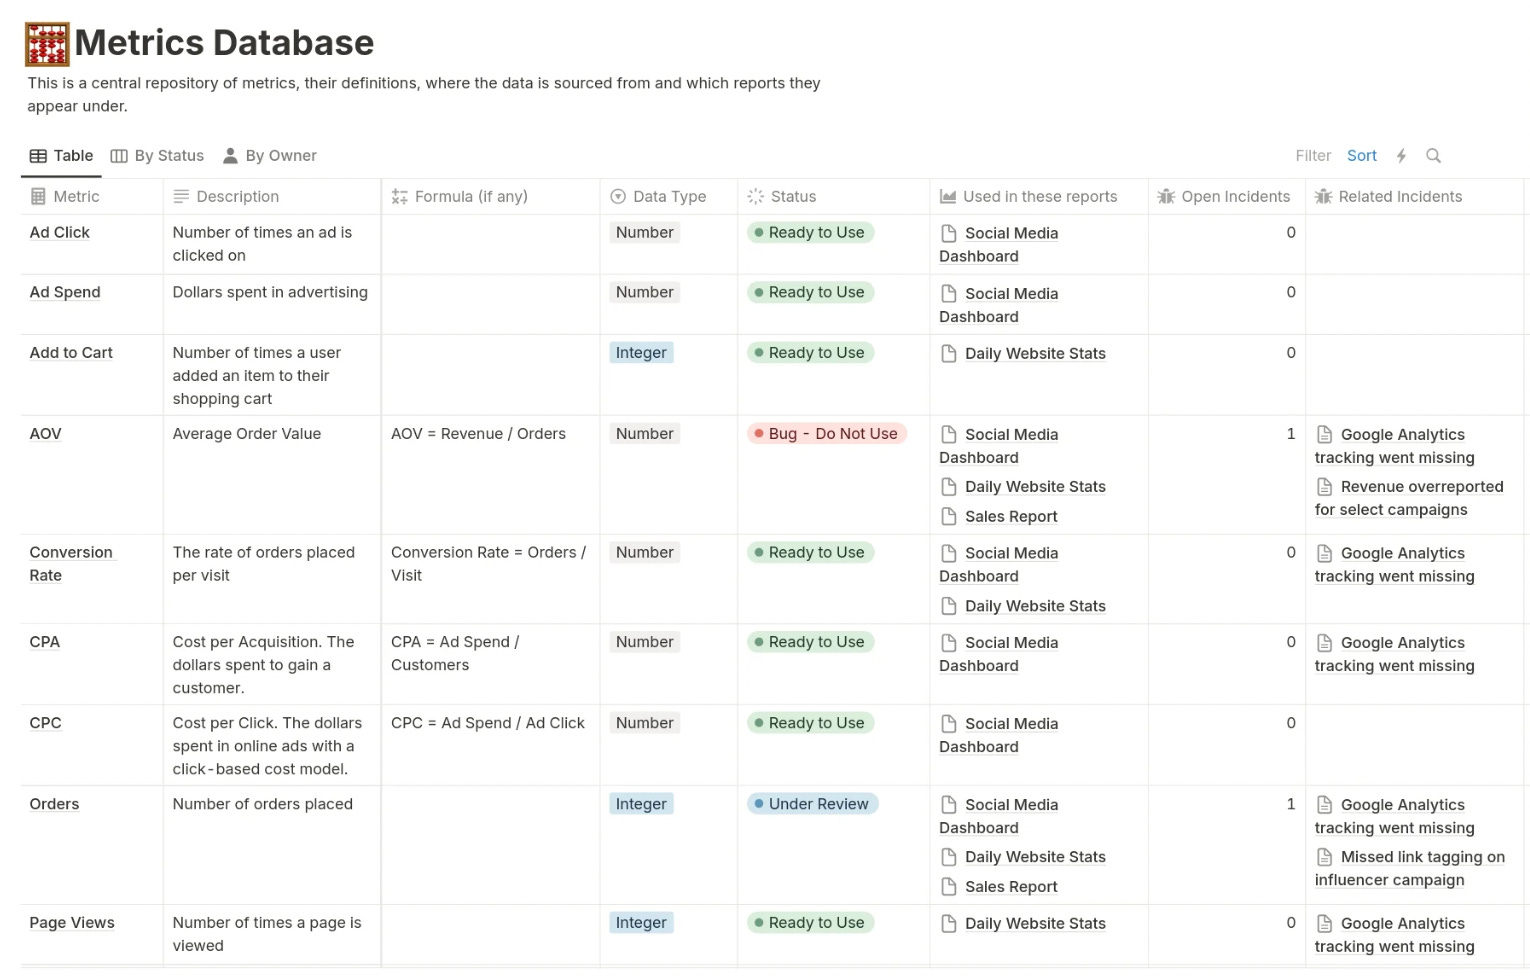
Start writing the name and description of the 10 metrics they ask you the most.
Fill the columns as you can including details like the calculation method, data sources, frequency of update and reports using the metric.
Prepare the ground
1️⃣ Show your base to the business team managers and ask them for each metric who should be the owner in their team.
2️⃣ Explain to them that the owner will be accountable for maintaining the information on this data (the definition, calculation method, etc.).
3️⃣ Once they are identified, add the column “Business Owner” and tag them so they’ll be notified.
4️⃣ Prepare a simple email to explain to the owners what it means and why we’re doing this : to get a single source of truth for all metrics ! But mostly to help business teams to answer to their “data daily questions” on metrics definition, the data sources of these metrics, etc.
💡 This simple knowledge base will show you that there’s room for optimization. You’ll notice that some reports are not bringing anything new.
Create a hype
It may sound stupid, but make it nice to look at.
Then, craft a nice Teams post to communicate the launch of your metrics base. Mention all owners, and say it’s the new source of truth for all metrics-related questions.
👉 Make it a must-have easily accessible in a shared digital space :
Encourage teams to reference this document regularly and update it as needed
Send weekly reminders about it on Teams
Reinforce its usage by integrating it into your key processes, whether it's project planning, reporting, or performance reviews
Re-Focus
Great, now you have a common knowledge base that should answer a good 50% of questions 👉 the easy ones.
Now let’s deal with difficult questions like :
The results are different with same calculation mode
With your metrics base, you’ll highlight some critical issues like this one.
This is where data inconsistencies and context come into play.
To address this :
1️⃣ Ensure that everyone is pulling data from the same source and using consistent time frames or filters
2️⃣ Investigate if there are variations in the underlying data sets (e.g., different data refresh times, missing data, or different versions of the source)
3️⃣ Establish a process for resolving these discrepancies
You can create a dedicated review mechanism, where the business owners come together to analyze and align on a single, verified result. At first you’ll be coordinating this review mechanism.
4️⃣ Encourage transparency by documenting the investigation steps and final decisions in the knowledge base
So overall to deliver value with no resources, you just need :
A survey tool
A central repository
Your brain
🔍 Tip : At this point, you just need to define business owners. Don’t go into too complicated roles, forget about data owners or data stewards.
We’ll see in a next post what data engineers have to do from there.
See you soon,
Charlotte
I'm Charlotte Ledoux, freelance in Data & AI Governance.
You can follow me on Linkedin !
Love it, this is a well-written and down to earth way to do it
This is really valuable. Data Governance almost always starts with low resources, it's right down their low on people's list to solve. I like the idea of quantifying the problem and questions first. It helps work out the challenges and what you're trying to solve.
I appreciate the post.