


Real-Life Wins in Data Governance
#16 Or how to show the value

Hello 😀
A former colleague called me the other day and said :
“My new director wants to start doing Data Governance without having any use cases in mind, can you give me some concrete examples?”

If you haven't already, you can also :
Discover my coaching services
Join +200 readers of “Data Governance : where to start?”
Let’s see what it looks like 👇
Agenda
Why real-life examples matters
Case #1 : Product mapping with Retool
Case #2 : Citizen data analyst with CastorDoc
Why real-life examples matters
Well, typically for these moments where your Top Executives are not really understanding all these new concepts around Data.
Who can blame them? Every day there’s a new buzzword out there : data mesh, GenAI, data product, … 🤯
Data governance frameworks can appear abstract and complex, especially when described in general terms.
👉 You need to build a promise behind the word Data Governance with real-life examples.
Real-life examples provide context, showing how data governance is applied within specific industries or organizational scenarios.
Illustrations will also :
reveal the unique challenges faced during data governance implementation
and show the tangible benefits !
Case #1 : Product mapping with Retool
The Challenge
🛍 FMCG companies always struggle with getting sellout data, as they sell to retailers. It is the only type of data that allows to measure shoppers demand since they come from the actual sales.
Business Acceleration and Marketing Insights teams face ongoing issues to consolidate sellout data for all products : redundancy, inconsistency, and excessive manual workloads. Because they need to compare datasets from various sources, both internal and coming from third-party providers.
❌ This is time-consuming, with significant maintenance efforts required to ensure data accuracy and alignment.
The Solution
Build a master referential database specifically designed for product data, serving as a comprehensive source of truth.
This database standardizes product attributes across several key dimensions and incorporates both the company's portfolio and competitor products, making it an all-encompassing repository for sellout analysis.
Sounds awesome, how did you do?
Here are the steps followed :
1️⃣ Workshops with business teams to define product categories, segments, types and price bands
2️⃣ Definition of the data model with relations between attributes and levels of a product required
3️⃣ Retool setup and UI development : Retool is a low-code solution for rapid UI development with native integration with major databases like DataBricks, Snowflake, SQL, etc.
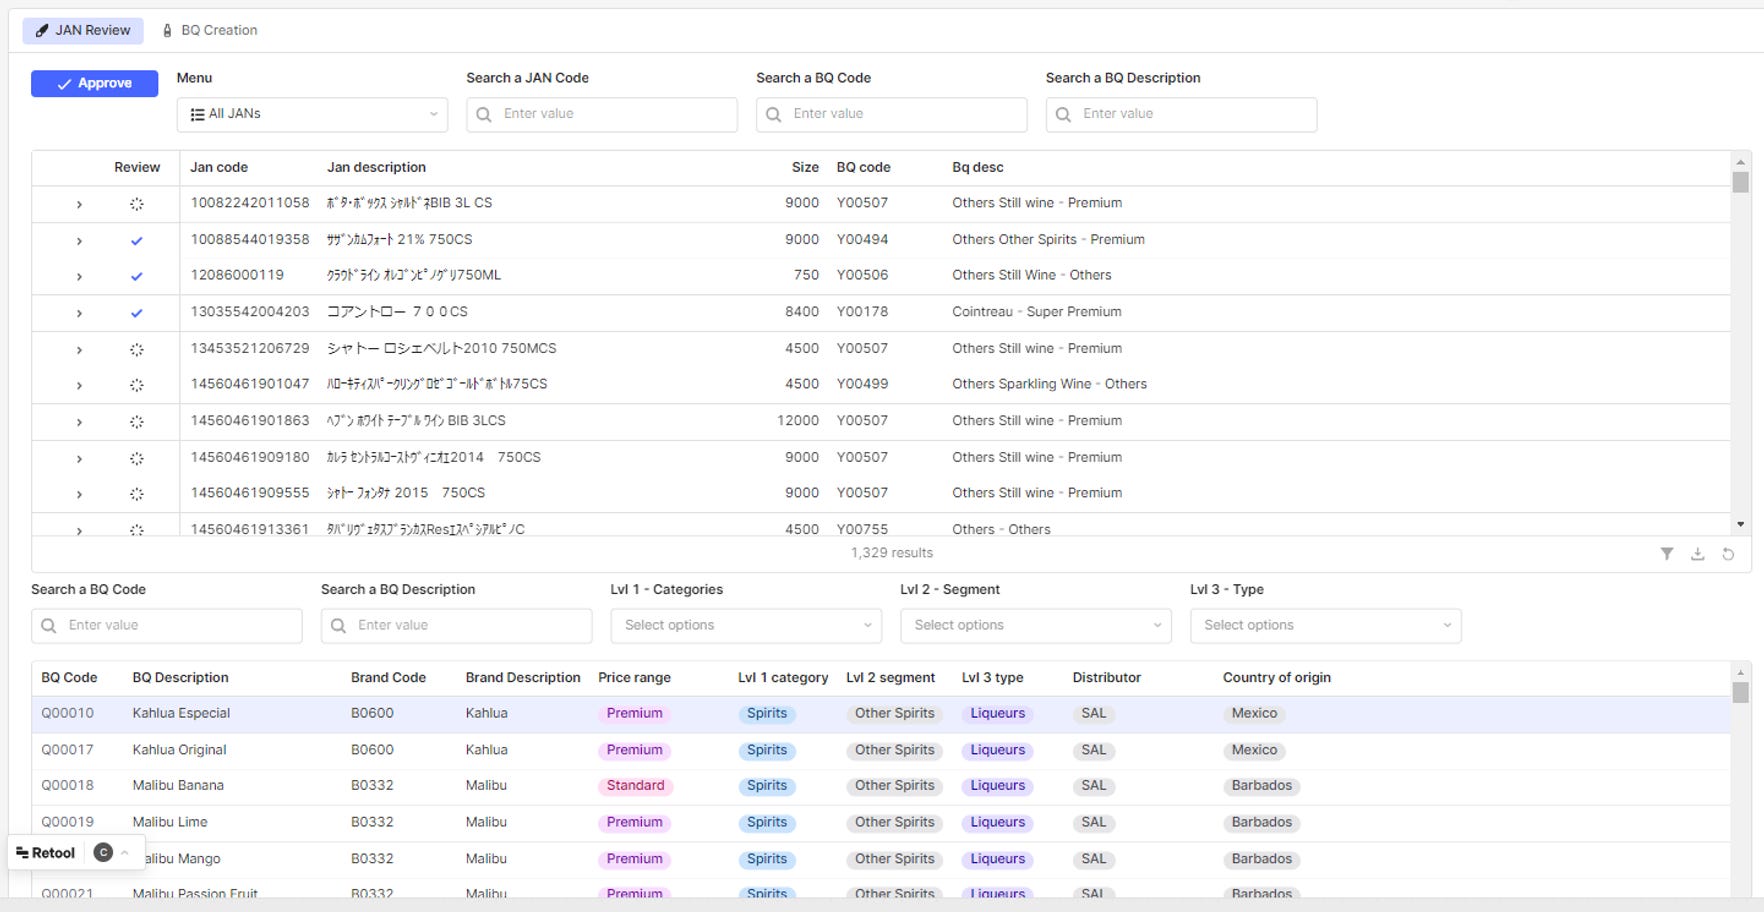
You’ve never used Retool? Checkout this awesome course below and get 100$ off ! 👇
4️⃣ Iterations based on real usage and business needs. Some features are added during development : specific market product flagging, type enhancements and adjustments in pricing and brand qualities.
For each new product, OpenAI is prompted to infer the category, brand and brand quality.

5️⃣ Use of this master referential database as a key data source for reports on market share performance, market trends, promotions investments, etc.
6️⃣ Onboarding of a data steward to approve the AI-powered mapping suggestions every week.
The Impact
New products are mapped through AI-powered suggestions, helping greatly reduce workload on data tasks of Data Stewards.
The master referential database supports various marketing reports offering a granular view of the market. This integration allows teams to gain actionable marketing insights on specific market segments.
Case #2 : Citizen data analyst with CastorDoc
The Challenge
👥 As a non-tech company growing rapidly, HomeServe was struggling with data democratization. The data team was buried under report creation requests from different business units, and KPIs were calculated inconsistently across departments. The lack of documentation made it challenging for new team members, who required a full week just to understand basic data structures.
❌ The traditional centralized approach wasn't scalable as company data needs grew.
The Solution
HomeServe developed a"Citizen Data Analyst" model built on three core pillars. They implemented CastorDoc as their central knowledge hub, easy to access through a Chrome extension and an AI assistant working within their existing tools.
The team structured their data preparation to match different user expertise levels and established a single source of truth for metrics. They also set up a Data Academy program, where they offered training sessions and hands-on support to empower business users.
Sounds awesome, how did they do?
1️⃣ Started with the foundation
Partnered with Keyrus consultancy to establish best practices
Leveraged CastorDoc's data lineage to map data relationships and dependencies
Built unified approach to metrics and KPIs with automated documentation

2️⃣ Rolled out in phases
Data team first enriched CastorDoc with comprehensive documentation
Started with early adopters in partnerships team
Gradually expanded access across other business units
3️⃣ Made it part of daily workflow
Embedded CastorDoc in existing tools via the AI assistant available through Slack and the Chrome extension.

The Impact
The transformation to a self-service model improved HomeServe's data culture. Business teams became independent in generating their own reports and analyzing performance, while maintaining governed data.
The data team shifted from report creation to more strategic projects, and the AI assistant made business users autonomous in answering their data questions.
Want to be part of this newsletter?
Become a sponsor, book a slot here to discuss it with me !
See you soon,
Charlotte
I'm Charlotte Ledoux, freelance in Data & AI Governance.
You can follow me on Linkedin !